
Gross revenue retention is the percentage of recurring revenue you kept from customers you already had, counting only what was lost. Take a group of customers' recurring revenue at the start of a period, subtract downgrades and cancellations, and divide by the starting figure.
Upgrades are left out on purpose. That is why the result can never be above 100%, and why it shows losses that a net figure can hide.
Quick answer: GRR = (starting MRR − contraction − churn) ÷ starting MRR, for the same group of customers over a period, commonly 12 months. Expansion and new customers are excluded, so 100% is the ceiling. A cohort that starts at $20,000 and loses $4,400 has a GRR of 78%.
What gross revenue retention measures
Gross revenue retention (GRR) follows a fixed group of customers, called a cohort, from one date to a later one and asks how much of the starting recurring revenue is still there. The unit is monthly recurring revenue (MRR) or its annual version, ARR.
Two things reduce it:
- Contraction. A customer stays but pays less: fewer seats, a lower plan, a renewal discount.
- Churn. A customer cancels, and their recurring revenue falls to zero.
Nothing increases it. A customer who upgrades counts at the amount they paid on the start date and no more. Customers who signed after the start date aren't in the cohort at all.
GRR is the other side of gross revenue churn, and the two add up to 100%. The article on the SaaS churn rate covers the churn side.
It is an operating metric, the kind of figure also called a key performance indicator. No accounting standard defines it under US GAAP or IFRS, so every company that reports it writes its own definition. Three of those definitions appear further down.
The gross revenue retention formula
Written out in full:
GRR = (Starting MRR − Contraction MRR − Churned MRR) ÷ Starting MRR × 100
Every part refers to the same cohort.
| Part | What goes in it |
|---|---|
| Starting MRR | Recurring revenue from every customer active on the start date |
| Contraction MRR | Decreases from customers who stayed but now pay less |
| Churned MRR | The starting MRR of customers who left |
| Left out | Expansion from existing customers, and everything from customers who signed later |
A second route gives the same number and works as a check. For each customer in the cohort, take the lower of what they paid at the start and what they pay at the end. Add those amounts and divide by starting MRR. An upgraded customer is capped at the starting amount, a downgraded customer counts at the new lower amount, and a churned customer counts as zero.
Worked example: GRR for a ten-customer cohort
A software company had ten customers on January 1, 2025, paying a combined $20,000 a month. The table shows what each paid on that date and on December 31, 2025. The last column is the lower of the two.
| Customer | MRR, January 1 | MRR, December 31 | Change | Counted toward GRR |
|---|---|---|---|---|
| A | $4,000 | $6,900 | +$2,900 | $4,000 |
| B | $3,000 | $3,000 | $0 | $3,000 |
| C | $2,500 | $1,900 | −$600 | $1,900 |
| D | $2,400 | $0 | −$2,400 | $0 |
| E | $2,000 | $3,200 | +$1,200 | $2,000 |
| F | $1,800 | $1,800 | $0 | $1,800 |
| G | $1,500 | $1,100 | −$400 | $1,100 |
| H | $1,200 | $1,900 | +$700 | $1,200 |
| I | $1,000 | $0 | −$1,000 | $0 |
| J | $600 | $600 | $0 | $600 |
| Cohort total | $20,000 | $20,400 | +$400 | $15,600 |
Apply the formula one step at a time.
- Starting MRR: $20,000.
- Contraction (C and G): $600 + $400 = $1,000.
- Churn (D and I): $2,400 + $1,000 = $3,400.
- Numerator: $20,000 − $1,000 − $3,400 = $15,600.
- GRR: $15,600 ÷ $20,000 = 0.78, or 78%.
The last column of the table agrees: it also adds up to $15,600. Gross revenue churn for the year is the remaining 22%, which is the $4,400 lost divided by $20,000.
Customers A, E and H upgraded by $2,900 + $1,200 + $700 = $4,800. None of that enters the calculation.
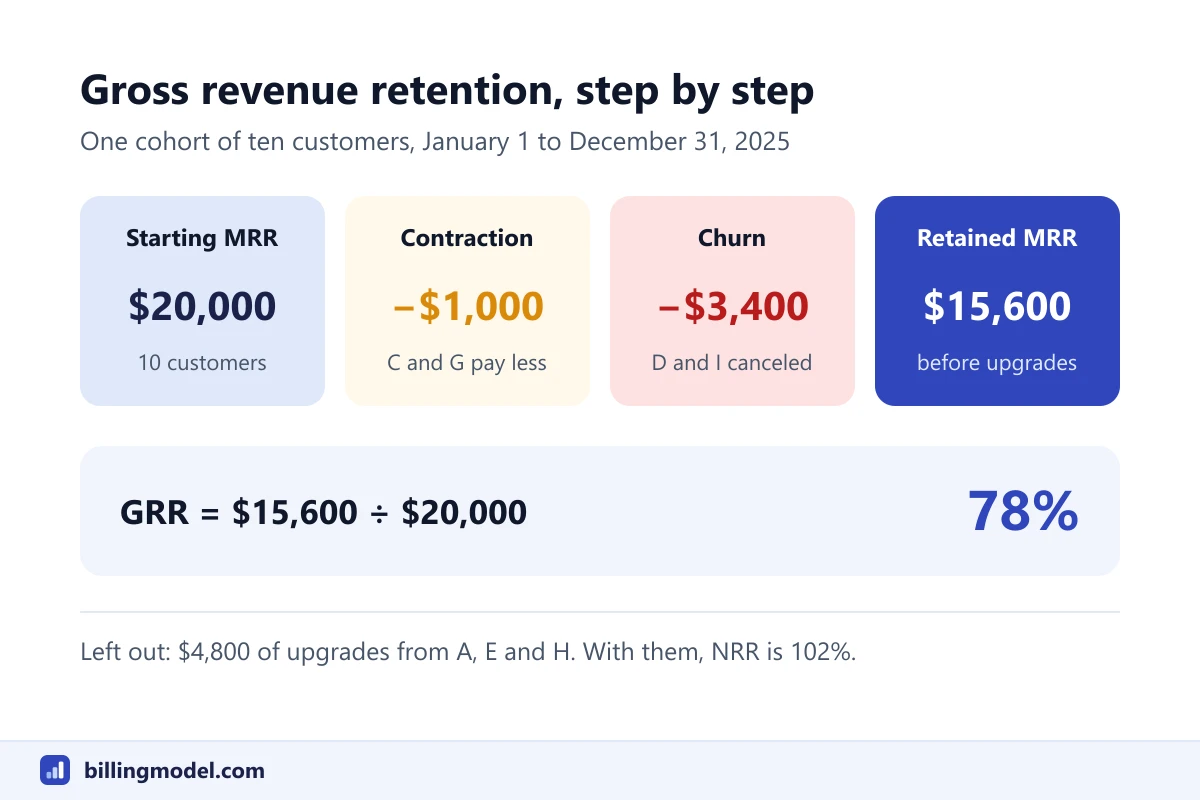 The cohort kept $15,600 of its $20,000 starting MRR before upgrades, a GRR of 78%.
GRR vs NRR, and why companies report both
Net revenue retention (NRR) uses the same cohort and the same starting figure but adds expansion back. For this cohort it is ($20,000 + $4,800 − $1,000 − $3,400) ÷ $20,000 = $20,400 ÷ $20,000, or 102%. The net revenue retention formula is covered in its own article.
| GRR | NRR | |
|---|---|---|
| Counts contraction and churn | Yes | Yes |
| Counts expansion | No | Yes |
| Highest possible result | 100% | No upper limit |
| Example cohort | 78% | 102% |
| Question it answers | How much of the base did you keep? | Did the existing base grow? |
Read alone, 102% says the customer base is slightly bigger than a year ago. GRR shows what sits underneath. The company lost $4,400 of its $20,000, and three accounts covered the hole with $4,800 of upgrades.
That cover is thin. Customer A supplied $2,900 of the $4,800. Had A stayed flat, the same year would have ended at $17,500, an NRR of 87.5%, with GRR unchanged at 78%.
This is the reason to report both. NRR gives the net result. GRR tells you how much expansion was needed to get there, and the gap between them (24 points here) is that expansion as a share of starting revenue.
GRR vs logo retention
Logo retention counts customers and ignores what they pay: customers still active at the end divided by customers at the start. Eight of the ten are still paying on December 31, so logo retention is 80%.
The same cohort produces four different retention figures, depending on what you count.
| Measure | Calculation | Result |
|---|---|---|
| Logo retention | 8 ÷ 10 customers | 80% |
| GRR, churn and contraction | $15,600 ÷ $20,000 | 78% |
| GRR, churn only | ($20,000 − $3,400) ÷ $20,000 | 83% |
| NRR | $20,400 ÷ $20,000 | 102% |
Logo retention and GRR drift apart for two reasons. The first is size. D and I were 20% of the customers but paid $3,400, or 17% of starting MRR. If I and J had left instead, logo retention would still be 80%, while churned MRR would be $1,600, only 8% of the base.
The second is downgrades. C and G are still customers, so logo retention can't see that they now pay $1,000 less between them. GRR can.
Monthly vs annual measurement
A GRR figure is incomplete without its period. Losses accumulate, so a monthly rate looks far better than an annual rate for the same business.
Compounding shows the size of the gap. A cohort that keeps 98% of its remaining revenue every month keeps 0.98 multiplied by itself 12 times, which is 0.785, or about 78.5% over a year. The example cohort's 78% annual GRR is in line with losing roughly 2% a month.
Treat that conversion as rough, because it assumes the same rate every month. In a Marketing Science paper, Peter Fader of Wharton and Bruce Hardie of London Business School report that retention rates at the cohort level typically increase over time, because customers with a high chance of leaving go first. Their analysis counts customers, not revenue, but it is a reason for care: a rate measured on a young cohort and multiplied forward may overstate later losses. Once you have 12 months of history, measure the annual figure directly.
Two of the companies quoted below, Clearwater Analytics and Weave, measure across twelve months. Weave builds its figure from monthly calculations, which is a different thing from a month-over-month rate.
How public companies define gross revenue retention
The definitions differ, and the differences change the result. Three examples from annual reports filed with the US Securities and Exchange Commission (checked October 2026):
Workday. Its annual report for the year ended January 31, 2026 gives a gross revenue retention rate of approximately 97% as of that date. Workday takes the ARR of its customers at the corresponding prior period-end and compares it with ARR from the same set of customers at the current period-end. The rate counts recurring revenue lost to product or customer churn. It doesn't count add-ons or net expansions, which the filing says include volume and price adjustments.
Clearwater Analytics. Its annual report for the year ended December 31, 2025 starts from annual contract value at the beginning of a 12-month period, subtracts client attrition over those 12 months, and divides by the starting figure. Annual contract value is annualized recurring revenue plus what the filing calls contracted-not-billed revenue. Attrition occurs when a client gives a contract termination notice. The reported rate was 98% for each quarter of 2025.
Weave Communications. Its annual report for the year ended December 31, 2025 defines a dollar-based gross revenue retention rate by customer location. For a base month, it measures how much of that month's revenue came from locations still subscribed twelve months later. The reported figure is a weighted average of those monthly rates over the trailing twelve months. The filing says GRR reflects locations that terminate and "does not reflect changes in revenue due to revenue expansion, revenue contraction" or new locations. The rate was 89% as of December 31, 2025, against 91% a year earlier.
| Workday | Clearwater Analytics | Weave | |
|---|---|---|---|
| Based on | ARR | Annual contract value | Adjusted monthly revenue per location |
| What reduces it | Product or customer churn | Client attrition | Location terminations |
| Period | Prior period-end to current period-end | 12 months | 12 monthly year-over-year rates, averaged |
| Rate reported | About 97% (January 31, 2026) | 98% (each quarter of 2025) | 89% (December 31, 2025) |
In the three filings opened for this article, the deduction is for customers, products or locations that were lost. None of the three definitions names a deduction for a customer who kept the same service and paid less. Workday's puts volume and price adjustments under net expansions, outside the rate, and Weave says outright that revenue contraction is not reflected. Other companies may define the rate differently. The formula in this article is stricter because it subtracts contraction too. On the example cohort, the churn-only version gives 83% where the full version gives 78%.
Neither version is wrong. The SEC's 2020 guidance on performance metrics notes that metrics "can vary significantly from company to company and industry to industry." It says the Commission would generally expect a clear definition of a metric and how it is calculated, why it is useful to investors and how management uses it. That guidance applies to companies that file with the SEC. A private company has no such rule, but the habit is worth copying: decide whether contraction counts, write it down, and keep it the same every period.
One caution on what GRR is not. It is built from MRR or ARR, which are management figures and not recognized revenue. What appears on the income statement follows the rules for SaaS revenue recognition. The treatment of a specific contract depends on its terms and should be confirmed with a qualified accountant.
Frequently asked questions
Can gross revenue retention be above 100%?
No. Upgrades and new customers are excluded, so the most a cohort can keep is all of its starting revenue. A reported figure above 100% means expansion has been let into the calculation, and the number is really NRR.
Is GRR the same as 100% minus the churn rate?
It is 100% minus the gross revenue churn rate for the same cohort and period. It is not 100% minus customer churn, which counts accounts. In the example, customer churn was 20% and gross revenue churn was 22%.
What is a good gross revenue retention rate?
There is no official benchmark. The three filings above reported about 97%, 98% and 89%, each under its own definition, and all three deduct only customers, products or locations that were lost. The more useful comparison is your own rate over time, calculated the same way, read next to NRR and the other SaaS metrics.
Does a price increase raise GRR?
Not under the formula here. Extra revenue from an existing customer is expansion, whatever caused it, and it shows up in NRR. A price cut given to keep a customer is contraction and lowers GRR. Company definitions vary: Workday's puts price adjustments with net expansions, outside its gross rate.
Should GRR be calculated from MRR or ARR?
Either works if both snapshots use the same unit and the same cohort. MRR suits monthly plans. ARR is the natural unit for annual contracts, and it is what Workday's definition uses.