LTV in SaaS is customer lifetime value: an estimate of the margin one subscriber brings in between signing up and canceling. The simple version multiplies average revenue per account by gross margin and divides by the churn rate.
The arithmetic takes ten seconds. The trouble is that it rests on a churn rate that is assumed never to change, and the academic work on subscriptions shows that it does. Treat the result as a rough estimate, and check it against your own cohorts.
Quick answer: LTV = ARPA × gross margin ÷ churn rate, with all three on the same period. At $100.00 a month, an 80% gross margin and 3% monthly churn, LTV is $80.00 ÷ 0.03 = $2,667. Against a $600 acquisition cost that is 4.4 to 1, with a CAC payback of 7.5 months.
The simple LTV formula for SaaS
Harvard Business School Online's guide to LTV and CAC gives the general form: LTV = m × T, where m is the yearly contribution margin from an average customer and T is the average time, in years, that a customer stays. Its example is a $115 margin for three years, an LTV of $345.
A subscription business can't observe T directly for customers who are still paying, so it estimates it from churn. If a fixed share of customers leaves each period, the average customer stays 1 ÷ churn periods. Substitute that for T and you get the formula used in SaaS:
LTV = ARPA × gross margin ÷ churn rate
| Input | What it means | Where it comes from |
|---|---|---|
| ARPA | Average recurring revenue per account, per month | MRR ÷ paying accounts |
| Gross margin | Share of revenue left after the cost of delivering the service | (Revenue − cost of delivering the service) ÷ revenue |
| Churn rate | Share of customers lost per month | Customers lost ÷ customers at the start of the month |
The monthly recurring revenue formula and the SaaS churn rate articles cover the first and third inputs. All three must use the same period: monthly ARPA goes with monthly churn.
Why it matters is retention. In a Knowledge at Wharton interview, Daniel McCarthy of Emory says a firm that keeps its customers can ease off acquisition spending over time, while one that doesn't stays "on something of an acquisition treadmill."
A worked example
Use the company from this site's overview of SaaS metrics. It ends March 2026 with 418 customers and $41,800 of MRR. Customer churn was 3.0% for the month, gross margin is 80%, and it spent $18,000 on sales and marketing to win 30 new customers.
- ARPA: $41,800 ÷ 418 = $100.00 a month.
- Margin per account: $100.00 × 0.80 = $80.00 a month.
- Expected lifetime: 1 ÷ 0.03 = 33.3 months.
- LTV: $80.00 ÷ 0.03 = $2,667.
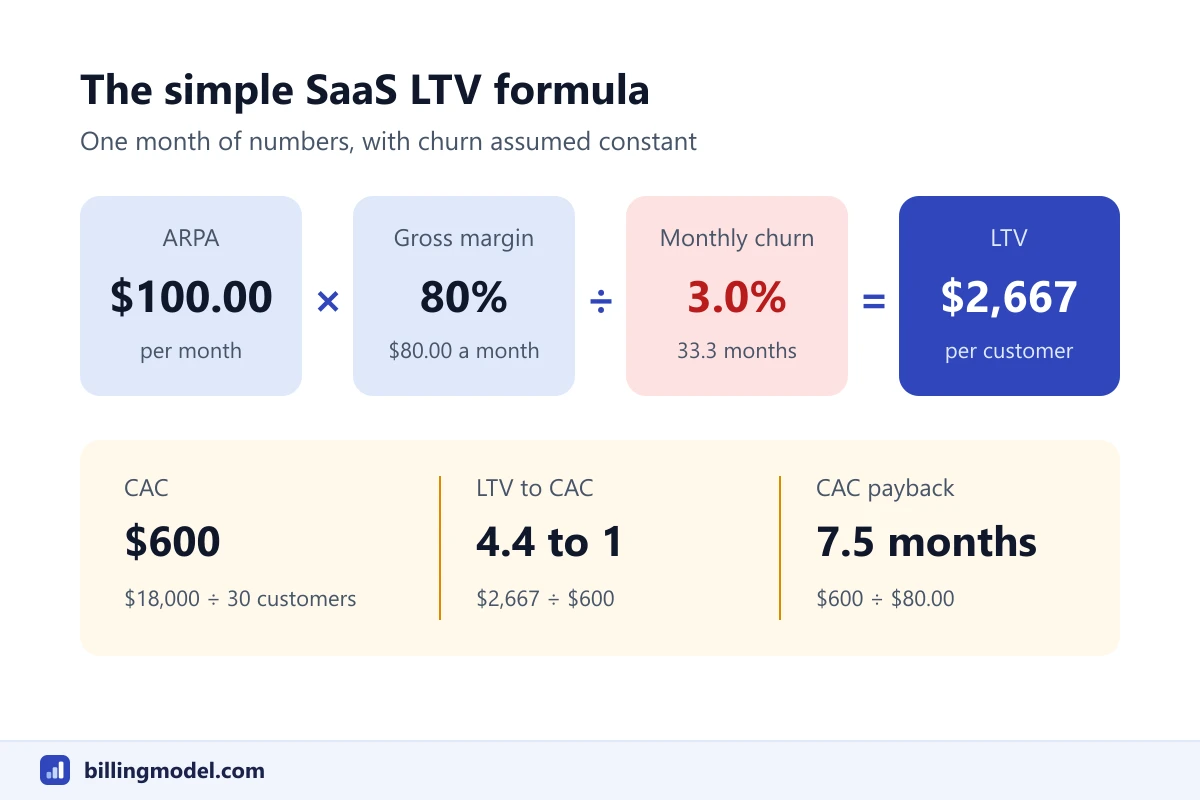 The simple formula with one month's numbers: $80.00 of monthly margin over an expected 33.3 months.
LTV to CAC and CAC payback
Customer acquisition cost (CAC) is what you spend to win one customer. Here it is $18,000 ÷ 30 = $600.
LTV to CAC = LTV ÷ CAC = $2,667 ÷ $600 = 4.4
CAC payback = CAC ÷ (ARPA × gross margin) = $600 ÷ $80.00 = 7.5 months
The ratio compares the whole estimated relationship with its cost. HBS Online says a ratio below one means you spend more on acquiring customers than you receive from them. It also quotes HBS professor Christina Wallace, who calls it "a good rule of thumb" that "an LTV-to-CAC ratio of three or higher is attractive and indicates a scalable business" able to cover its marketing costs and overhead and still make a profit. That is one teacher's rule of thumb, not a measured benchmark, and it is only as good as the LTV you feed it.
Payback asks a narrower question, how long until the margin from a customer covers the cost of winning them, and it doesn't need a lifetime estimate. Definitions vary here too. Klaviyo's 2023 registration statement defines its CAC payback period as the number of months it would take for non-GAAP gross profit to exceed adjusted selling and marketing expenses.
Which costs go into margin and CAC changes both results. A 2026 MIT Sloan working paper by Hiram Samel and Aditya Chaudhry lists LTV/CAC and months to recover CAC among the software metrics that were calibrated against adjusted figures leaving out stock-based compensation.
Why the simple formula overstates or understates
Churn is not constant. In a Marketing Science paper, Peter Fader of Wharton and Bruce Hardie of London Business School show that a cohort's retention rate rises as it ages, because the customers most likely to leave go first. In their illustration, valuing a customer base with one aggregate retention rate understates it by 38%. Using patterns fitted to two real data sets, the shortfall is 28% and 48%.
A two-segment sketch shows why. Suppose 100 new customers are 40 steady ones who churn at 1% a month and 60 fragile ones who churn at 6%. Blended first-month churn is 4%, so the simple formula says $80 ÷ 0.04 = $2,000 each. Valued by segment, the steady customers are worth $80 ÷ 0.01 = $8,000 and the fragile ones $80 ÷ 0.06 = $1,333, an average of $4,000. The single rate cut the answer in half.
The error can run the other way. A company-wide churn rate mixes old and new customers, so it can understate the losses in a new customer's first months. The cohort table below shows that happening.
Money later is worth less. An MIT Sloan Management Review article on research by Sunil Gupta and Donald Lehmann of Columbia says any lifetime value calculation must take three factors into account: margin, retention rate and a discount rate, the cost of capital. The simple formula has no discount rate. Adding one is this article's own derivation, not a formula taken from that research. With margin collected at the start of each month, a constant churn rate and a monthly discount rate d, the discounted sum works out to:
LTV = monthly margin × (1 + d) ÷ (churn + d)
Fader and Hardie use 10% a year in their illustration, which is 1.10^(1/12) − 1, or about 0.8% a month. That gives $80.00 × 1.008 ÷ 0.038 = $2,122, about 20% below $2,667.
Expansion and contraction are ignored. The formula holds ARPA flat for 33 months. If surviving customers upgrade, it understates. Swapping in net revenue churn is a tempting patch, and a risky one: the example company's net revenue churn was 1.0%, which turns the same month into $80 ÷ 0.01 = $8,000. A figure that triples when one input changes deserves a range. The net revenue retention formula is the better tool for expansion.
A cohort-based alternative
Instead of assuming a lifetime, measure what a real group of customers has paid. Take the 100 customers who signed up in January 2025, each at $100 a month and an 80% margin, and count who is still active each month.
| Month | Active customers | Margin that month | Cumulative margin per original customer |
|---|---|---|---|
| 1 | 100 | $8,000 | $80.00 |
| 2 | 93 | $7,440 | $154.40 |
| 3 | 88 | $7,040 | $224.80 |
| 4 | 84 | $6,720 | $292.00 |
| 5 | 81 | $6,480 | $356.80 |
| 6 | 78 | $6,240 | $419.20 |
| 7 | 76 | $6,080 | $480.00 |
| 8 | 74 | $5,920 | $539.20 |
| 9 | 72 | $5,760 | $596.80 |
| 10 | 71 | $5,680 | $653.60 |
| 11 | 70 | $5,600 | $709.60 |
| 12 | 69 | $5,520 | $764.80 |
The table is an illustration, but it has the shape Fader and Hardie describe: 7% of the cohort leaves in the first month and about 1.4% in the last.
Three things come out of it.
- Observed first-year value is $764.80 per customer acquired. At a constant 3% churn the formula predicts $80 × (1 − 0.97^12) ÷ 0.03 = $816, so it overstates year one.
- Observed payback is ten months, not 7.5. Cumulative margin passes the $600 CAC during month 10, because some of the customers you paid for have already gone.
- Later years look better than the formula. Say 68 customers are active when month 13 starts. If they keep leaving at about 1.5% a month, they bring a further 68 × $80 ÷ 0.015 = $362,667, or $3,627 per original customer. Added to $764.80, that is $4,391 before discounting, against the formula's $2,667.
The last step is still a projection. It assumes the 1.5% holds for years, which nobody has observed yet. The first two results need no assumption at all, which is the argument for leading with them.
Note: LTV is an operating metric built on forecasts. It is not accounting revenue and appears in no financial statement. How revenue from a specific contract is recognized depends on its terms, so have a qualified accountant confirm the treatment.
Common mistakes
- Using revenue instead of margin. $100 ÷ 0.03 = $3,333, which is 25% too high. Comparing that with CAC ignores what it costs to serve the customer.
- Mixing monthly and annual figures. A 3% monthly rate compounds to 30.6% a year. Monthly margin over annual churn gives $80 ÷ 0.306 = $261. Annual margin over monthly churn gives $960 ÷ 0.03 = $32,000. Both are meaningless.
- Blending segments. As the two-segment sketch showed, one average hides customers worth $8,000 and $1,333. Calculate LTV by plan, customer size or acquisition channel, and set each against the CAC for that group.
- Projecting past your history. A 33-month lifetime from a company with 12 months of data is an extrapolation.
- Leaving costs out of CAC. Count the sales and marketing spend that produced the new customers, not only advertising.
Frequently asked questions
What is a good LTV to CAC ratio for SaaS?
No official benchmark exists. The only firm line is arithmetic: below one, you spend more to win a customer than you get back. The rule of thumb quoted above is a teaching heuristic, not data. Because LTV in SaaS depends on a projected churn rate, check the ratio against CAC payback, which uses fewer assumptions.
Should LTV use customer churn or revenue churn?
The simple formula pairs ARPA with customer churn, since both are per account. Using revenue churn folds in downgrades and, if it is the net figure, upgrades. Whichever you choose, state it and keep it, because the answers differ a lot.
How is LTV different from ARR or MRR?
MRR and ARR describe the recurring revenue you have today. LTV estimates the margin one customer will bring over the whole relationship, so it adds two forecasts: how long they stay and what serving them costs. The guide to ARR in SaaS covers the run-rate side.
Can a new company calculate LTV?
It can do the arithmetic, but the result leans on very little data. With a few months of history, cumulative margin per cohort and CAC payback are observed facts, and LTV is mostly a guess about the future. The estimate firms up as cohorts age.