There is no official average churn rate for SaaS. No regulator, standard-setter or statistics office collects one, and churn is not an audited number. The averages quoted online come from individual vendors' customer bases or from surveys, each with its own definition.
What does exist is a set of retention figures that listed software companies publish in their own filings, plus academic work on how retention behaves. Those figures run from about 2% of recurring revenue lost in a year to almost 3% lost in a month. Before you compare any of them with your own number, you need to know who the customers are and how the figure was calculated.
Quick answer: No audited or official average exists. In recent annual reports, two companies selling multi-year contracts report keeping about 97% to 98% of recurring revenue a year, two payroll software companies report 91% and more than 92%, and Zoom's online customers churn at 2.8% of recurring revenue a month. Your own cohort history is the better benchmark.
Why there is no single average churn rate for SaaS
Churn is an operating metric that no accounting standard defines, so every company writes its own formula. The US Securities and Exchange Commission's 2020 guidance on performance metrics says such measures "can vary significantly from company to company and industry to industry," and asks companies that publish one to give a clear definition and explain how it is calculated. The figures sit outside the audited statements. Zoom's annual report, for one, says it tracks its business metrics "with tools that are not independently verified by any third party."
Four choices change the result before any customer has done anything.
| Choice | The options | How filings differ |
|---|---|---|
| What is counted | Customers, or recurring revenue | Sirius XM counts subscribers. Paycom counts revenue. |
| Period | One month, or 12 months | Zoom reports a monthly average. Paycom measures a 12-month period. |
| What is a loss | Cancellations only, or downgrades too | Zoom includes downgrades. Paycom's formula counts the revenue of clients it lost. |
| Denominator | The whole base, or only contracts that came up for renewal | Workday starts from every customer it had at the prior period-end. ServiceNow measures customers that renewed or were lost in the period. |
The SaaS churn rate article covers the formulas. The point here is that an "average" built from numbers that differ on all four lines is an average of different things.
Benchmark reports from software vendors and investors have a second problem. Each describes that vendor's own customers or the companies that chose to answer a survey. A figure from one is only usable when you can read the report itself, with its sample and its definition. None is quoted here.
What listed software companies disclose
The table below gives retention or churn figures from five annual reports filed with the SEC (checked October 2026). Each row is one company's number under its own definition.
| Company and period | Customers and contracts | Measure, as the filing defines it | Figure |
|---|---|---|---|
| ServiceNow, 2025 | Subscriptions "typically have a three-year duration"; 603 customers with over $5 million of annual contract value | Renewal rate: 100% minus an attrition rate, which is the annual contract value of customers lost divided by that of customers that renewed or were lost in the period | 98%, the same as 2024 and 2023 |
| Workday, year ended January 31, 2026 | Contracts of three years or longer, generally noncancelable | Gross revenue retention: recurring revenue kept from the customers it had at the prior period-end, ignoring add-ons and expansion | About 97% |
| Paylocity, year ended June 30, 2026 | About 44,400 clients averaging over 150 employees | Annual revenue retention: revenue for the preceding 12 months minus the annualized recurring fees of clients lost in that time, divided by that revenue, leaving out interest on client funds | Greater than 92%, as in fiscal 2025 and 2024 |
| Paycom, 2025 | Target clients have 50 to 10,000 or more employees | Annual revenue retention: recurring revenue minus the trailing 12-month revenue of lost clients, divided by recurring revenue | 91%, up from 90% in 2024 and 2023 |
| Zoom, year ended January 31, 2026 | "Online" customers who subscribe through the website, from individual consumers upward | Online average monthly churn: recurring revenue canceled or downgraded in a quarter, divided by the opening figure, divided by three | 2.8% a month, after 2.9% and 3.1% |
Three cautions apply.
These five are not a sample. They are companies that chose to publish a retention number, and all are large and listed. Nothing here describes a ten-person startup.
All five are measured in revenue or contract value, not customers. For a count of customers you have to leave software: Sirius XM's annual report for 2025 gives a self-pay monthly churn of 1.5% for its satellite radio subscribers, calculated as average monthly deactivations divided by the average number of subscribers.
One company can hold both ends of the range. Zoom reports the 2.8% only for its online customers. For its enterprise customers, who brought in 60.3% of revenue, it reports a net dollar expansion rate of 98%, a different measure that includes upgrades.
Putting monthly and annual figures on one scale
A monthly rate and an annual rate can't be compared until one is converted, and the conversion compounds. The churn rate article explains the formula: annual churn = 1 − (1 − monthly churn)^12, and monthly churn = 1 − (1 − annual churn)^(1/12).
Applied to the figures above, that works out as follows. The conversions are this article's arithmetic, not numbers the companies report.
| Disclosed figure | Annual loss | Monthly equivalent |
|---|---|---|
| ServiceNow, 98% renewal rate | 2% | 0.17% |
| Workday, about 97% gross retention | 3% | 0.25% |
| Paylocity, over 92% retention | Under 8% | Under 0.69% |
| Paycom, 91% retention | 9% | 0.78% |
| Zoom online, 2.8% a month | 28.9% | 2.8% |
Zoom's 2.8% a month compounds to 1 − 0.972^12 = 28.9% a year. Paycom's 9% a year is 1 − 0.91^(1/12) = 0.78% a month. On the annual scale, the highest figure in the table is about fourteen times the lowest.
Converting fixes the time scale and nothing else. The rows still differ on what counts as a loss and on the denominator, and the formula assumes the same rate every month, which the next section shows does not hold for a group of new customers.
Why churn differs by customer size, contract length and price
Contract length sets when a customer can leave. A customer on a three-year, noncancelable contract can only go at renewal. A customer on a month-to-month plan can leave in any month. The 97% and 98% figures above come from two companies that describe contracts of three years or longer.
Small and young customers disappear for reasons unrelated to the product. Paycom's report says its retention rate "is negatively impacted when former clients are acquired or otherwise cease operations." In the United States, Bureau of Labor Statistics survival data cover private-sector establishments in every industry, not software customers. They show that 77.9% of those opened in the year to March 2024 were still operating a year later, and 51.4% of those opened in the year to March 2020 lasted five years. A vendor that sells to new businesses inherits that attrition.
Segments inside one business churn at different rates. In a Journal of Interactive Marketing paper, Peter Fader of Wharton and Bruce Hardie of London Business School reproduce survival data for two segments of an unnamed subscription business. After one year, 63.1% of "Regular" customers were still subscribed, against 86.9% of "High End" customers. After twelve years the figures were 17.3% and 39.4%.
New customers churn faster than old ones. From the same table, the Regular segment's annual churn works out to 36.9% in the first year, 25.8% in the second and 18.4% in the third. In a later Marketing Science paper, the same authors explain the pattern as a sorting effect: the customers most likely to leave go first, so the group that remains is steadier. It follows that a company adding many new customers will show higher churn than an older one with identical customers.
A worked example: build your own SaaS churn benchmark
A benchmark you can trust has your definition, your customers and your contract terms. That means your own history, split by segment and measured over a real 12 months.
Take the company used in the churn rate article: 3.0% monthly customer churn, which compounds to 30.6% a year. Check it directly. List every customer active on March 1, 2025, then count how many are still customers on February 28, 2026.
| Segment | Customers, March 1, 2025 | Still customers a year later | 12-month retention | Annual churn |
|---|---|---|---|---|
| Self-serve, monthly plans | 200 | 118 | 59.0% | 41.0% |
| Team, monthly plans | 100 | 78 | 78.0% | 22.0% |
| Annual contracts | 60 | 54 | 90.0% | 10.0% |
| All customers | 360 | 250 | 69.4% | 30.6% |
The arithmetic: 118 ÷ 200 = 59.0%, 78 ÷ 100 = 78.0%, 54 ÷ 60 = 90.0%, and 250 ÷ 360 = 69.4% overall. The blended 30.6% matches the compounded figure, and it describes none of the three segments.
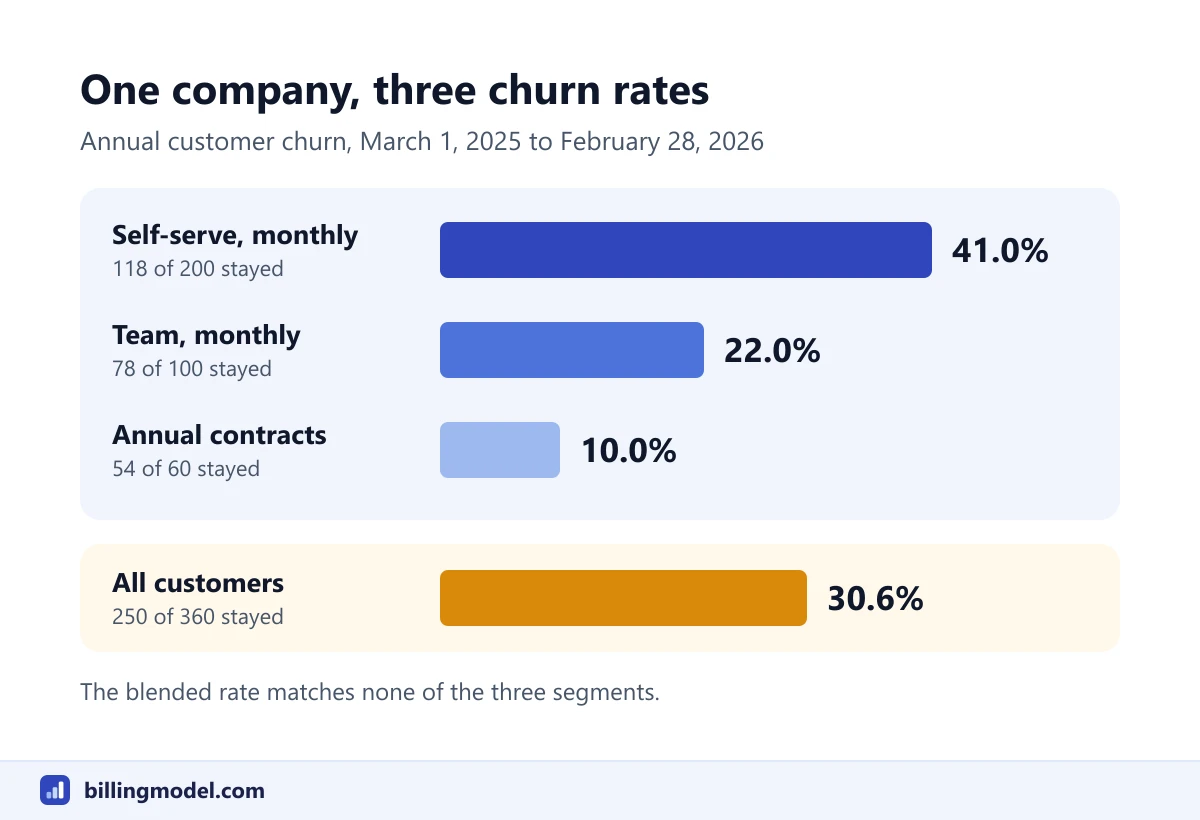 One company, three churn rates. The blended 30.6% is an average of segments that behave differently.
Now compare each segment with the same measurement a year earlier.
| Segment | Year to February 2025 | Year to February 2026 | Change |
|---|---|---|---|
| Self-serve, monthly plans | 55.0% (88 of 160) | 59.0% | +4.0 points |
| Team, monthly plans | 80.0% (56 of 70) | 78.0% | −2.0 points |
| Annual contracts | 90.0% (36 of 40) | 90.0% | No change |
| All customers | 66.7% (180 of 270) | 69.4% | +2.7 points |
Blended retention improved by 2.7 points while the team segment got worse. A single company-wide rate would have hidden that, and an outside "average" would have said nothing about it.
If you still want an outside comparison, match on all four choices from the first table. The annual-contract segment lost 10% of its customers, and Paycom's figure implies 9% of revenue lost. Those look close, but one counts customers and the other dollars, so they are not the same measurement.
Note: Churn and retention are operating metrics built from subscription records. They are not accounting revenue. How the revenue from a specific contract is recognized depends on its terms, and a qualified accountant should confirm it.
To do this with your own data, your subscription billing records need a start date, an end date and a plan for every customer. The same cohort table feeds the net revenue retention formula if you add what each customer pays.
Frequently asked questions
What is the average churn rate for SaaS companies?
No official or audited average exists. The five annual reports cited above show recurring revenue losses from about 2% a year for multi-year contracts to 2.8% a month for Zoom's online customers. Those are individual data points under different definitions, not an industry average.
Is 5% monthly churn high?
Convert it first: 5% a month compounds to 46.0% a year. Whether that is high depends on what you sell and to whom. None of the filings above sets a target, so compare the figure with your own earlier periods and with the segment it belongs to.
Where do published SaaS churn benchmarks come from?
They come from a vendor's own customer base or from a survey of companies that chose to respond. Before using one, find the report and check the sample size, who was included, whether it counts customers or revenue, and the period. If you can't find those four things, treat the number as an anecdote.
Should I benchmark customer churn or revenue churn?
Track both, and compare like with like. Every software figure in the table above is revenue-based, so setting your customer churn beside one of them will mislead you. The overview of SaaS metrics shows how the two differ for the same month.