An accounts payable aging report lists the bills you owe suppliers and sorts them by how long each one has been unpaid. It is the buyer's mirror of the receivables aging report: the same columns, with the money flowing the other way.
Indiana University's controller describes its version as a report that tracks the suppliers a unit owes money to and how long the debt has been outstanding. The total tells you how much you owe. The columns tell you how much of it is already late, and that is what you need before deciding who gets paid in the next run.
Quick answer: An accounts payable aging report groups unpaid supplier invoices into age buckets, by convention current, 1–30, 31–60, 61–90 and over 90 days past due, with a total and a percentage for each. In the example below, $40,000 of payables is 70% current and 30% past due. Use it to choose which bills to pay, catch discount deadlines and plan cash.
What an accounts payable aging report shows
The report has one row per supplier and one column per age bucket, with totals on the right and along the bottom. A detailed version lists every unpaid invoice under its supplier.
Accounts payable is what OpenStax's accounting textbook defines as the obligations owed to suppliers after buying products or services on credit. Its finance textbook calls the same thing trade credit: suppliers let you take delivery now and pay later.
Indiana University's report follows that layout. Its summary tab condenses the outstanding invoices into aging buckets as of the report date, its detail tab lists each invoice, and an invoice that has been paid no longer appears.
One limit applies to every version: the report only knows about bills that have been entered. Indiana's separates invoices still moving through approval from those approved for payment, and notes that the first group has not yet reached the general ledger. A bill sitting in someone's inbox is on neither list.
The standard aging buckets
The standard layout has the same five columns as the accounts receivable aging report, in 30-day steps.
| Bucket | What it holds | What to check |
|---|---|---|
| Current | Bills not yet due | Discount deadlines, and what falls due before the next payment run |
| 1–30 days past due | Bills that recently missed the due date | A missed approval or payment run |
| 31–60 days past due | Bills a month or more late | Whether the bill is disputed or on hold, and any late fee |
| 61–90 days past due | Bills two months or more late | The supplier relationship, and who owns the decision |
| Over 90 days past due | The oldest bills | Whether it is a real debt: a duplicate entry, an unapplied credit or a dispute nobody closed |
Five buckets are a convention, not a rule. Indiana University describes its own as ranging from less than 30 days to over 90 days.
Some reports look forward instead of back. North Carolina's State Controller publishes an aged unpaid invoice register that groups unpaid invoices by final payment due date, for up to four due dates, and totals the amounts due beyond three months. Columns that look back show what is late. Columns that look forward show when cash will leave.
Bills can be aged from the invoice date or from the due date, and the same bill lands in different columns depending on which you pick. The receivables article works through a dated example. State the basis in the report header and don't mix the two.
Example accounts payable aging report
This example is a made-up business with six suppliers, all on net 30 terms. Balances are aged by days past due as of September 30, 2026.
| Supplier | Current | 1–30 | 31–60 | 61–90 | Over 90 | Total |
|---|---|---|---|---|---|---|
| Supplier A | $14,000 | $0 | $0 | $0 | $0 | $14,000 |
| Supplier B | $6,000 | $2,000 | $0 | $0 | $0 | $8,000 |
| Supplier C | $4,000 | $3,000 | $1,500 | $0 | $0 | $8,500 |
| Supplier D | $2,000 | $0 | $0 | $0 | $0 | $2,000 |
| Supplier E | $0 | $1,000 | $1,300 | $1,200 | $0 | $3,500 |
| Supplier F | $2,000 | $0 | $0 | $800 | $1,200 | $4,000 |
| Total | $28,000 | $6,000 | $2,800 | $2,000 | $1,200 | $40,000 |
| % of total | 70% | 15% | 7% | 5% | 3% | 100% |
Each percentage is the column total divided by the grand total: $28,000 ÷ $40,000 = 70%, $6,000 ÷ $40,000 = 15%, and so on. The four past due columns add up to $12,000, which is 30% of payables. The two oldest columns add up to $3,200, or 8%.
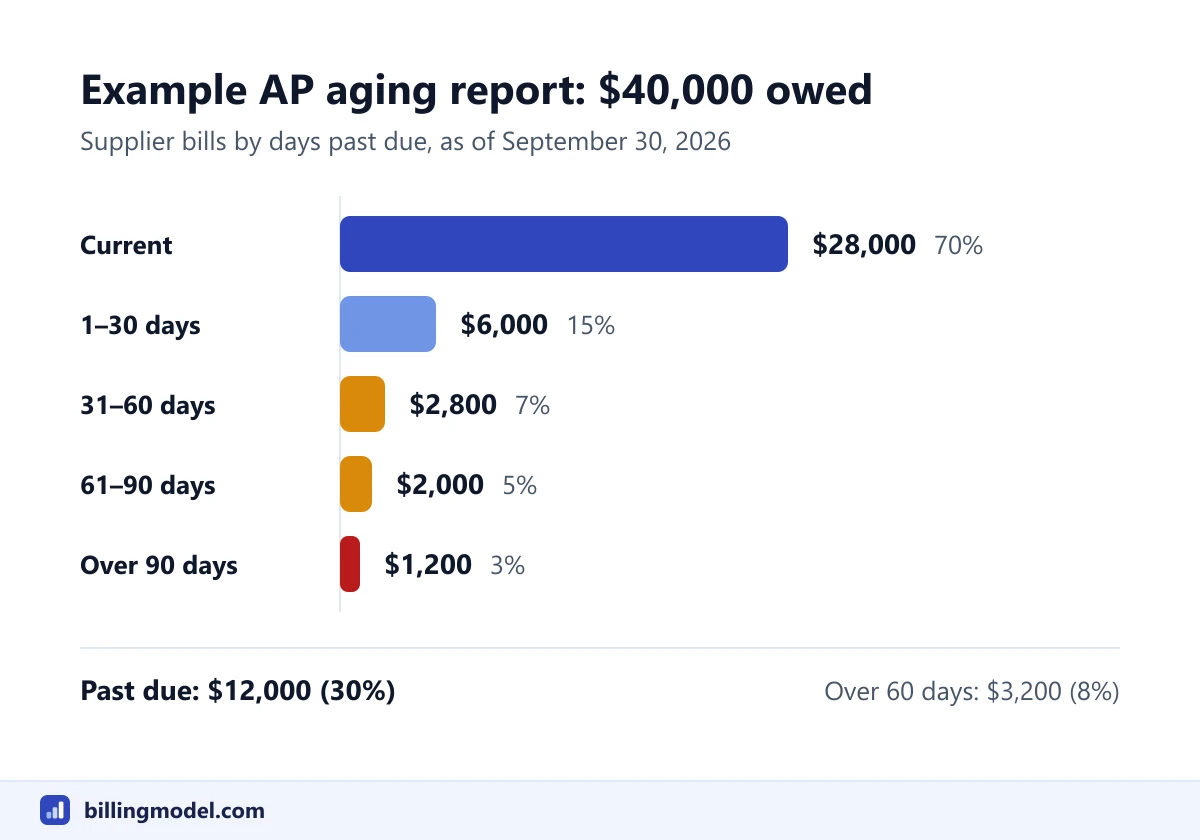 The example report's column totals. $12,000, or 30%, is past due.
Three rows deserve a second look:
- Supplier E has nothing current and $3,500 spread over three late columns. Every bill from this supplier is paid late, which points to a process fault, such as invoices going to the wrong approver.
- Supplier F has $2,000 current and $2,000 more than 60 days late ($800 + $1,200). New bills are being paid while old ones sit. That pattern suggests a dispute, a hold or a duplicate entry.
- Supplier C has $4,500 past due ($3,000 + $1,500) out of $8,500, which is 53%.
How to use the report
The Washington State Auditor's accounts payable guide (first edition, November 2021) calls aging reports critical to monitoring an accounts payable process and making sure vendors are paid on time. It suggests reviewing the non-current part, "probably anything over 30 days", to decide whether it is reasonable.
Decide which bills to pay, and when
Start with what is late, oldest first, and ask why each item is old before you pay it. The same guide lists the costs of paying late: strained vendor relations, penalties, late fees and second copies of invoices, which it calls a common cause of duplicate payments.
Paying early has a cost too. The guide's advice is to pay early only when you are taking an early-payment discount, because otherwise it can hurt cash flow. For everything else in the current column, the due date set by your invoice payment terms is the target.
Catch early-payment discounts
A plain aging report hides discount deadlines, because a discounted bill just sits in the current column. Add a discount date to the detail view.
Say Supplier A's $14,000 includes a $5,000 invoice dated September 24, 2026, on 2/10 net 30 terms. Paying by October 4 costs $5,000 × 98% = $4,900 and saves $100. Waiting until October 24 costs the full $5,000. OpenStax's finance textbook puts the annual cost of skipping a 2/10 net 30 discount at 36.73%, and the net 30 invoice article walks through that calculation.
Whether to take a discount is still a judgment about your own cash. The US Treasury's guidance for federal agencies, for example, says an agency may take an offered discount if it is economically justified (checked October 2026).
Plan cash
On net 30 terms, everything in the current column on September 30 falls due by October 30. Adding the $12,000 that is already late, this business needs up to $40,000 for bills in October. One way to lay it out, as an illustration:
| When | What gets paid | Amount |
|---|---|---|
| First payment run in October | Past due bills, except Supplier F's two old items on hold | $10,000 |
| By October 4 | Supplier A's discounted invoice | $4,900 |
| As each falls due in October | The rest of the current column ($28,000 − $5,000) | $23,000 |
| After review | Supplier F's old items, if they are owed | Up to $2,000 |
| Total | Up to $39,900 |
The total is $100 under $40,000 because of the discount. North Carolina's controller describes its aged invoice report in the same terms: it shows the day's ending liability balance and identifies future cash requirements.
Spot duplicates, disputes and credits
Old items are where errors collect. Before paying anything in the two oldest columns, check that the bill wasn't entered twice, that it isn't waiting on a dispute, and that the supplier hasn't already credited it.
Two cross-checks help. The Washington guide calls reconciling vendor statements to payables records an industry best practice for identifying duplicate payments and other discrepancies, and the billing statement example shows what the supplier's side looks like. It also says to review aged supplier credits in case a refund should be requested. A negative number on the report is such a credit, and the credit memo example and debit note articles cover the documents behind it.
Note: Check the report total against the accounts payable balance in your ledger. Indiana University's page points out that its report total is only part of the general ledger balance, and gives the calculation that ties the two together.
AP aging and days payable outstanding
Days payable outstanding (DPO) compresses the same balance into one number: the average number of days a business takes to pay its suppliers. NetApp's annual report for fiscal 2018, filed with the SEC, calculates it by dividing accounts payable by the average cost of revenues per day for the quarter.
Apply that to the example. If cost of sales for the quarter from July 1 to September 30, 2026 (92 days) was $92,000, the daily figure is $1,000 and DPO is $40,000 ÷ $1,000 = 40 days. On net 30 terms that suggests bills are paid about 10 days late on average. The aging report shows the lateness is not spread evenly: 70% of the balance is on time, and four suppliers account for the $12,000 that isn't.
Definitions vary. OpenStax's finance textbook uses a different formula under the name payables deferral period: 365 divided by accounts payable turnover. The article on DSO and DPO compares the versions.
AP aging vs AR aging
| AP aging report | AR aging report | |
|---|---|---|
| Lists | Unpaid bills from suppliers | Unpaid invoices sent to customers |
| What it is | Money you owe | Money owed to you |
| One row per | Supplier | Customer |
| Buckets | Current, 1–30, 31–60, 61–90, over 90 | The same |
| An old balance means | You are late, or the bill is disputed or wrong | The customer is late or disputing |
| Main use | Scheduling payments and planning cash out | Collections and planning cash in |
| Summary metric | DPO | DSO |
| A negative number means | The supplier owes you a credit or refund | You owe the customer a credit or refund |
The two reports describe the same invoices from opposite ends. Your late item in a supplier's 31–60 column is the same bill sitting in the 31–60 column of your own payables.
Common mistakes with AP aging reports
- Paying the oldest column without asking why it is old. A duplicate entry paid is money you have to chase back.
- Treating late payment as free financing. OpenStax's finance textbook notes that some trade credit arrangements specify an interest penalty or a late fee once an account is delinquent. The rules are covered in late fees on invoices.
- Paying early with no discount. It moves cash out sooner for nothing in return.
- Forgetting bills that haven't been entered. The report understates what you owe by every invoice still waiting for approval.
- Ignoring supplier credits. An unused credit is cash you have already paid out.
- Mixing aging bases. Some bills aged from the invoice date and others from the due date make the columns meaningless.
Frequently asked questions
What is an accounts payable aging report used for?
It shows which supplier bills are due and which are overdue, so you can schedule payments, take discounts in time, forecast the cash you need and find bills that are stuck in a dispute or entered twice.
How often should you run an AP aging report?
Before every payment run, because that is when the decision is made. That is this article's own rule, not a published one. Indiana University's page says running its report regularly makes sure invoices are approved for timely payment, and it sets no frequency.
What does a negative number on an AP aging report mean?
The supplier owes you. A credit memo or an overpayment is sitting on the account without being applied to a bill. Apply it to the next payment or ask for a refund.
What is the difference between AP aging and AR aging?
AP aging sorts the bills you owe suppliers. AR aging sorts the invoices customers owe you. The buckets are the same, and the two reports feed opposite sides of your cash forecast.