An accounts receivable aging report lists the money customers owe you and sorts it by how long each invoice has been unpaid. Indiana University's controller describes the report's purpose as showing which customers have unpaid balances, how much they owe and how long those balances have been outstanding.
It answers a question the receivables total can't: how much of the money is late, and how late. A $50,000 balance that is all within terms is a different thing from a $50,000 balance with a large share three months overdue.
Quick answer: An accounts receivable aging report groups open invoices into age buckets, usually current, 1–30, 31–60, 61–90 and over 90 days past due, with a total and a percentage for each. In the example below, $50,000 of receivables is 60% current and 40% past due, with 6% more than 90 days late.
What an accounts receivable aging report shows
The report has one row per customer and one column per age bucket, with totals on the right and along the bottom. A detailed version lists every open invoice under its customer.
Accounts receivable is what OpenStax's accounting textbook defines as an outstanding customer debt on a credit sale: you have delivered and invoiced, and the customer hasn't paid yet.
Indiana University's page lists three uses for the report:
- managing cash flow and spotting overdue payments
- estimating bad debt expense and revising the allowance for doubtful accounts
- judging how promptly customers pay, and whether more credit or collection effort is needed
The standard aging buckets
The standard layout has five columns in 30-day steps.
| Bucket | What it holds | Usual response |
|---|---|---|
| Current | Invoices not yet due | None |
| 1–30 days past due | Invoices that recently missed the due date | Reminder, then a second notice |
| 31–60 days past due | Invoices a month or more late | Phone call, then a final notice |
| 61–90 days past due | Invoices two months or more late | Final deadline, and a review of the customer's credit |
| Over 90 days past due | The oldest debts | Decide on escalation or a write-off |
The response column follows the sequence in the guide to chasing a past due invoice. Thirty-day steps also line up with net 30 invoice terms, where each bucket is one more full payment period missed.
Five buckets are a convention, not a rule. The University of South Carolina's controller ages its receivables in six ranges: 1–30, 31–60, 61–90, 91–120, 121–180 and 180+ days. The University of Tennessee's accounts receivable procedure uses eight categories, running from 0–30 days to over 12 months. Longer payment terms or slow-paying customers are reasons to add columns past 90 days.
Aged from the invoice date or the due date?
The same invoice lands in different buckets depending on where you start counting. Indiana University's report counts the days between an invoice's approval date and the date the report is run. South Carolina's page doesn't state a starting point, but it describes every balance that falls in its ranges as past due.
Take an invoice dated July 15, 2026, on net 30 terms, so it is due August 14, 2026. On a report run as of September 30, 2026:
- From the due date: August 14 to September 30 is 47 days, so it sits in the 31–60 bucket.
- From the invoice date: July 15 to September 30 is 77 days, so it sits in the 61–90 bucket.
Neither basis is wrong. Aging from the due date tells you how late a payment is. Aging from the invoice date tells you how long cash has been tied up. State the basis in the report's header, and don't mix the two.
Example accounts receivable aging report
This example is a made-up business with six customers on net 30 terms. Balances are aged by days past due as of September 30, 2026.
| Customer | Current | 1–30 | 31–60 | 61–90 | Over 90 | Total |
|---|---|---|---|---|---|---|
| Customer A | $12,000 | $0 | $0 | $0 | $0 | $12,000 |
| Customer B | $6,000 | $2,500 | $0 | $0 | $0 | $8,500 |
| Customer C | $0 | $4,000 | $2,400 | $0 | $0 | $6,400 |
| Customer D | $7,000 | $1,500 | $2,600 | $0 | $0 | $11,100 |
| Customer E | $0 | $0 | $0 | $3,200 | $1,800 | $5,000 |
| Customer F | $5,000 | $0 | $0 | $800 | $1,200 | $7,000 |
| Total | $30,000 | $8,000 | $5,000 | $4,000 | $3,000 | $50,000 |
| % of total | 60% | 16% | 10% | 8% | 6% | 100% |
Each percentage is the column total divided by the grand total: $30,000 ÷ $50,000 = 60%, $8,000 ÷ $50,000 = 16%, and so on. The four past due columns add up to $20,000, which is 40% of receivables. The two oldest columns add up to $7,000, or 14%.
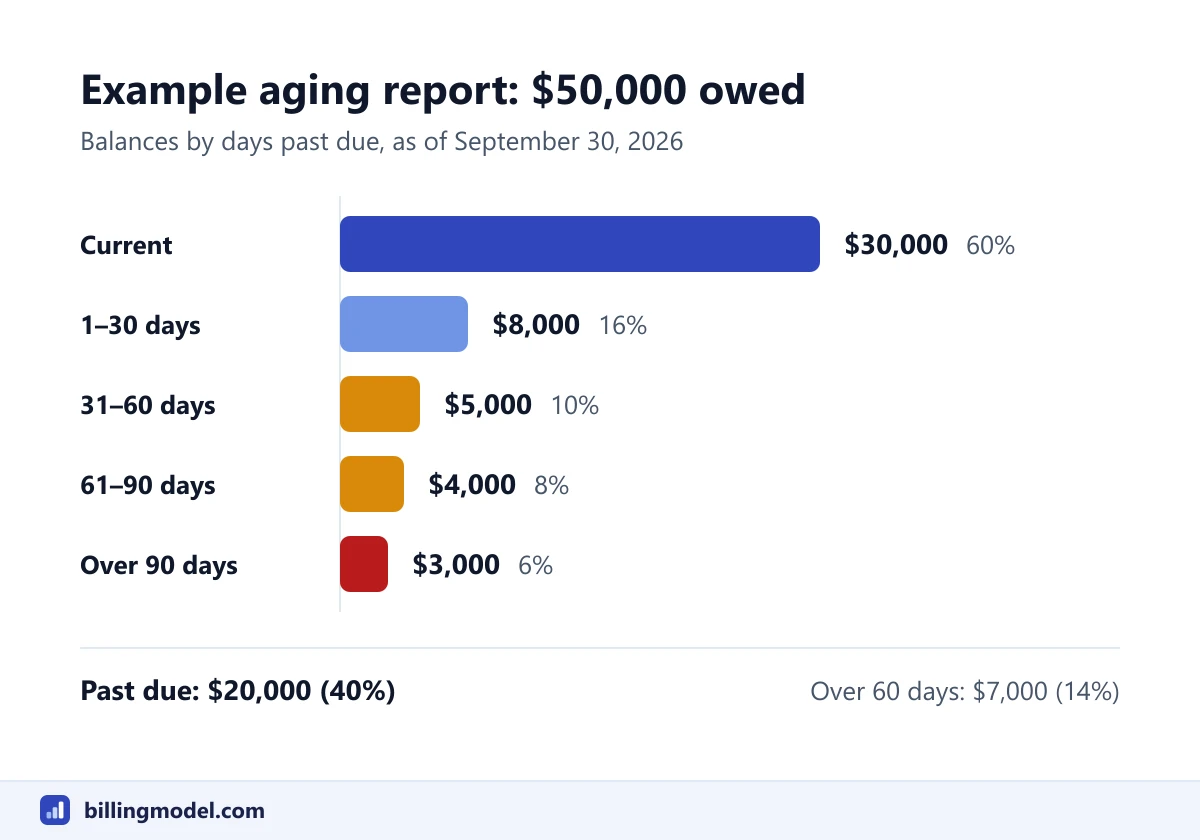 The example report's column totals. $20,000, or 40%, is past due.
How to build the report
- List every open invoice with its invoice date, due date and unpaid balance.
- Pick the report date. Days past due is the report date minus the due date.
- Put each balance in its bucket. An invoice that isn't due yet is current.
- Subtotal by customer and total each column.
- Divide each column total by the grand total to get the percentages.
- Check that the grand total equals the accounts receivable balance in your ledger.
Accounting software produces the report from the same data. The last step still needs a person. Penn State's receivables procedure, for example, requires both a monthly aging analysis and a monthly reconciliation of receivable balances.
How to read an aging report
Read it from right to left, oldest money first.
Start with the over 90 column. It holds $3,000 from two customers. Customer E owes $5,000 and all of it is more than 60 days late. E is 10% of total receivables ($5,000 ÷ $50,000) but 71% of everything over 60 days ($5,000 ÷ $7,000). One account explains most of the old debt.
Look for mixed rows. Customer F has $5,000 current and $2,000 in the two oldest columns ($800 + $1,200). A customer who pays new invoices while old ones sit unpaid may be disputing those invoices, or may have made a payment that was never matched to them. Call before you escalate.
Look for drift. Customer D has the second-largest balance, $11,100, and $4,100 of it is past due ($1,500 + $2,600), which is 37%. Nothing is very old, but late balances in two columns point to a habit, not a one-off. Indiana University's guidance says to watch for customers who consistently pay slowly and may need follow-up.
Compare the percentage row over time. One report is a snapshot. If the past due share was 32% a month ago and is 40% now, collection is slipping even if the total hasn't moved.
Check negative numbers. A minus figure in any column means a payment or credit is sitting on the account without being applied to an invoice, or the customer has overpaid. The credit memo example shows how a credit is matched to an invoice so that it leaves the report.
Note: No universal figure says what share of receivables should be current. It depends on your terms, your customers and your industry. Compare the report with your own earlier months before you compare it with anyone else's.
Using the aging report to estimate uncollectible accounts
The aging report is also the starting point for estimating how much of your receivables will never be paid. Under the aging method, each bucket's balance is multiplied by an estimated uncollectible percentage that rises with age, and the results are added up to give the allowance for doubtful accounts. OpenStax's worked example applies 10% to balances 0–30 days past due, 20% to 31–90 days and 30% to over 90 days, on the reasoning that an account 90 days overdue is more likely to go unpaid than one 30 days past due.
Those rates belong to that textbook example. Yours would come from your own collection history, and accounting standards set their own requirements for the estimate, so have an accountant confirm the method. The article on the aging of accounts receivable method works through the calculation.
How the aging report relates to DSO
Days sales outstanding (DSO) compresses the same receivables into one number: how many days of sales are sitting unpaid. Definitions vary from company to company. Harris Interactive's annual report for fiscal 2006, filed with the SEC, calculated DSO as period-end accounts receivable, adjusted for unbilled amounts and deferred revenue, divided by daily revenue. Daily revenue was the period's revenue divided by its number of calendar days.
Apply the plain version of that formula to the example. Suppose credit sales for the quarter from July 1 to September 30, 2026 (92 days) were $115,000:
- Daily sales: $115,000 ÷ 92 = $1,250
- DSO: $50,000 ÷ $1,250 = 40 days
OpenStax's textbook takes a different route to the same idea. Its number of days' sales in receivables is 365 divided by the accounts receivable turnover ratio, where turnover is net credit sales divided by average accounts receivable. The two formulas can give different answers for the same business, so say which one you use. For more on each, see the articles on average DSO and the days sales in receivables formula.
The two tools do different jobs. A DSO of 40 days on net 30 terms suggests customers are taking roughly 10 days longer than the terms allow, on average. The aging report shows that the lateness isn't spread evenly: 60% of the balance is on time, and $7,000 is more than 60 days late. DSO tells you whether collection as a whole is speeding up or slowing down. The aging report tells you which invoices are responsible.
Common mistakes with aging reports
- Mixing bases. Aging some invoices from the invoice date and others from the due date makes the columns meaningless.
- Ignoring unapplied credits. The customer's total is right, but a column still shows an old debt that has in fact been settled.
- Not reconciling. If the report total doesn't match the ledger, at least one of them is wrong.
- Treating disputes as lateness. A disputed invoice needs a decision, not a fourth reminder.
- Running it once a year. South Carolina's controller provides aging reports to its users monthly, and Penn State's procedure calls for a monthly analysis.
Frequently asked questions
What are the standard aging buckets for accounts receivable?
Current, 1–30, 31–60, 61–90 and over 90 days past due. Some organizations add later columns such as 91–120 and 121–180 days. The set you choose matters less than using the same one every month.
How often should you run an accounts receivable aging report?
Monthly is the pattern in the published procedures cited here. A business with few invoices, or one that is short of cash, can run it weekly, since accounting software builds it from data that already exists.
Should the report age invoices from the invoice date or the due date?
Either works if you apply it consistently and label it. Aging from the due date shows how late payments are, which is what collection follow-up needs. Aging from the invoice date shows how long cash has been tied up.
Does an aging report show bad debt?
Not directly. It shows how old each balance is. The estimate of what won't be collected is a separate calculation that starts from the aging columns and applies a percentage to each one.
What does a negative balance on an aging report mean?
A payment or a credit memo hasn't been matched to an invoice, or the customer has overpaid. Apply it to the right invoice, or refund it if nothing is owed, so the report shows the customer's true position.