No single average DSO applies to every business. Days sales outstanding (DSO) depends on the payment terms you offer, the industry you sell into, how much of your revenue is paid upfront, and how the figure is calculated. Published figures for 2025 run from about 14 days for US retail corporations as a group to 81 days at one technology services company.
So the useful comparison comes in two parts. First, measure your DSO against your own terms. Then look at published data, knowing exactly whose numbers they are.
Quick answer: A "normal" DSO is one close to the payment terms you actually offer. For outside reference, US Census Bureau data for 2025 works out to roughly 47 days for manufacturing corporations, 37 for wholesale, 52 for the information sector and 14 for retail. Individual companies' filings show figures from 35 to 81 days.
Why there is no single average DSO
Three things move the number before collection performance comes into it.
Terms. A company on net 60 terms will show a higher DSO than one on net 30, even if every customer pays on the due date. OpenStax's finance textbook says credit terms usually range from 30 to 90 days depending on the industry.
Revenue mix. Sales paid at the moment of purchase create no receivable. A business with a large share of card or cash sales has a low DSO when it is measured against total sales, which is why retail sits so far below the other sectors in the Census figures later in this article.
Definition. Companies that publish a DSO build it differently. The three filings quoted below use ending receivables against a 90-day revenue average, average receivables against average daily revenue, and a version that adds contract assets and subtracts part of deferred revenue. The article on the days sales in receivables formula shows one set of books producing anything from 37 to 60 days, depending on the inputs.
Compare with your own terms first: DSO vs best possible DSO
The first benchmark is your own receivables with nothing overdue. The Credit Research Foundation (CRF), a membership organization that surveys companies on receivables performance, defines the pair of measures in its performance measures paper:
- DSO = ending total receivables × days in the period ÷ credit sales for the period
- Best possible DSO = current receivables × days in the period ÷ credit sales for the period
- Average days delinquent = DSO − best possible DSO
Current receivables are those not yet past due. CRF describes best possible DSO as the level of receivables with no delinquency, and says the closer DSO is to it, the closer receivables are to their optimal level. It adds that best possible DSO should relate closely to your terms of sale.
This DSO uses the ending balance, the same approach as the example in the accounts receivable aging report article. OpenStax's textbook version uses average receivables. Use one consistently.
Worked example: two companies, one quarter
Both companies are made up. Each had $460,000 of credit sales in the quarter from July 1 to September 30, 2026, which has 92 days.
| Company A (net 30 terms) | Company B (net 60 terms) | |
|---|---|---|
| Credit sales for the quarter | $460,000 | $460,000 |
| Ending total receivables | $210,000 | $310,000 |
| Of which current (not past due) | $160,000 | $300,000 |
| Of which past due | $50,000 | $10,000 |
| DSO | 42 days | 62 days |
| Best possible DSO | 32 days | 60 days |
| Average days delinquent | 10 days | 2 days |
Company A: $210,000 × 92 ÷ $460,000 = 42 days. Its best possible DSO is $160,000 × 92 ÷ $460,000 = 32 days, so 10 days of its DSO is lateness.
Company B: $310,000 × 92 ÷ $460,000 = 62 days, and $300,000 × 92 ÷ $460,000 = 60 days. Only 2 days are lateness.
B's DSO is 20 days higher than A's, and B is the one collecting closer to its terms. Set against an outside "average" of, say, 45 days, A would look fine and B would look poor. Both conclusions would be wrong.
The gap also has a cash value. A's credit sales run at $5,000 a day ($460,000 ÷ 92), so 10 days of delinquency is the $50,000 past due.
Published DSO figures, and whose they are
Each figure below comes from a named source, with its date and what it covers. None is a target.
US Census Bureau: sector aggregates for 2025
The Census Bureau's Quarterly Financial Report publishes quarterly aggregate financial results and positions for US corporations. It covers manufacturers with domestic assets of $5 million or more, and mining, wholesale, retail and selected service corporations with assets of $50 million or more.
It doesn't publish a DSO. The figures in this table are this site's arithmetic on its totals: receivables at the end of the fourth quarter of 2025, divided by net sales for the four quarters of 2025, times 365. Amounts are in millions of dollars, as shown on the St. Louis Fed's FRED database in October 2026. Each sector name links to its receivables series, and each net sales total links to the quarterly sales series it was added up from.
| Sector | Net sales, 2025 | Trade receivables, end of 2025 | DSO (calculated) |
|---|---|---|---|
| All manufacturing | $8,053,959 | $1,026,804 | 46.5 days |
| All wholesale trade | $3,826,367 | $383,209 | 36.6 days |
| All information | $1,859,047 | $263,103 | 51.7 days |
| All retail trade | $4,380,265 | $170,244 | 14.2 days |
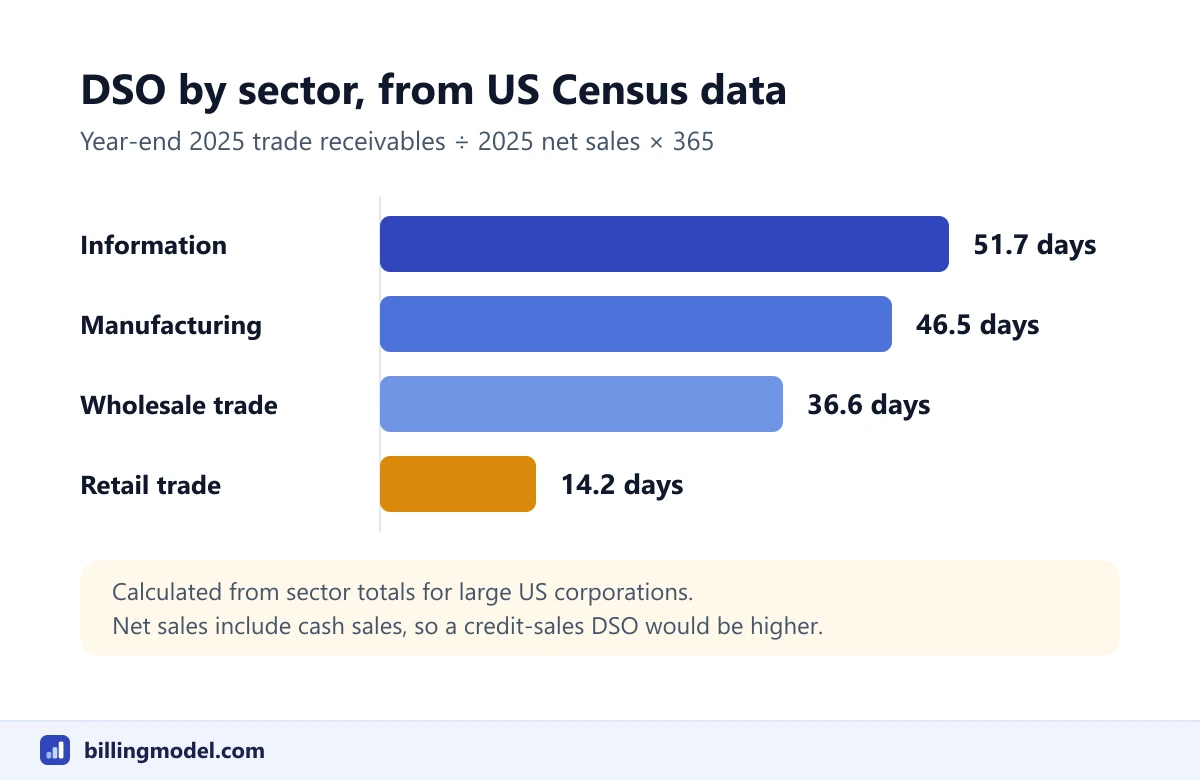 DSO calculated from Census Bureau sector totals for 2025: year-end trade receivables ÷ net sales × 365.
Read these with three limits in mind. The denominator is all net sales, not credit sales, so each figure is lower than a credit-sales DSO would be. Receivables are net of the allowance for doubtful accounts. And each row is a total for large corporations across a whole sector, weighted toward the biggest. "All information" is an entire sector, not software companies alone. Values for past quarters can also change when a series is updated.
Individual companies, from SEC filings
Some public companies disclose their own DSO. These are single examples with each company's own definition, not averages.
| Company | DSO | As of | How the filing calculates it |
|---|---|---|---|
| HP Inc. | 35 days | October 31, 2025 (fiscal 2025) | Ending receivables, net of allowance, ÷ a 90-day average of net revenue |
| HealthStream | 37 days | Year 2025 | Average receivables, excluding unbilled and other receivables, ÷ average daily revenues |
| Cognizant | 81 days | December 31, 2025 | Receivables net of allowance plus contract assets, less the uncollected portion of deferred revenue |
The same filings show how the numbers drift. HP reported 28 days for fiscal 2023, 33 for fiscal 2024 and 35 for fiscal 2025, each measured at the end of October. HealthStream, which sells subscription software to healthcare organizations, reported 40 days for 2024 and 37 for 2025. Cognizant reported 77, 78 and 81 days at the end of 2023, 2024 and 2025.
A member survey: the Credit Research Foundation
CRF runs a quarterly survey of domestic trade receivables. Its results summary for the second quarter of 2026 gives a median DSO of 37.50 days, a median best possible DSO of 34.00 days and median average days delinquent of 3.70 (checked October 2026). The page says each median is calculated independently, which is why 37.50 minus 34.00 doesn't come to 3.70.
The summary page doesn't say how many companies responded or which industries they are in. Treat it as an indication from that group, not a sampled statistic.
The buyer's side: how long large UK companies take to pay
Payment data from buyers isn't DSO, but it shows what a supplier to those buyers can expect. In the United Kingdom, large businesses must report their payment practices twice a year. The Department for Business and Trade's statistics for 2025, published in July 2026 from 11,178 reports, give a median average time to pay of 32 days (checked October 2026).
By the paying company's sector, the median was 45 days in manufacturing, 37 in wholesale and retail, 31 in professional, scientific and technical services, and 29 in information and communication. The figures are self-reported and not independently verified.
Is there an average DSO for software or SaaS?
No reliable public average for software companies was found for this article. The Census Bureau's information sector is the nearest official aggregate, and it is far broader than software. The company filings above are single data points. Figures quoted elsewhere without a named source, a date and a sample size are not included here.
Software billing also bends the measure. A subscription invoiced a year in advance creates a large receivable against revenue that is recognized month by month, which pushes a revenue-based DSO up. Some filers adjust for this: Cognizant's definition, for example, subtracts the uncollected portion of deferred revenue. The deferred revenue journal entry article explains the accounting behind that timing.
How to benchmark your own DSO
- Fix one formula. Decide on ending or average receivables, credit or total sales, and the day count. Write it down.
- Compute best possible DSO alongside it. The gap is what collection effort can change. The rest is your terms.
- Track your own trend. Twelve months of your own figures, computed the same way, say more than any outside average.
- Compare like with like. If you use an outside figure, match its formula, its period and its kind of business.
- Look underneath. When the gap widens, the aging report shows which invoices caused it, and the steps for a past due invoice deal with them.
Note: A falling DSO isn't always good news. OpenStax's accounting textbook points out that very fast collection can mean credit terms are too tight, which may send qualified customers to competitors.
DSO is an analysis measure, and the sources quoted here each define it in their own way. Which receivables and which revenue belong in it depends on your company's facts, so have a qualified accountant confirm the definition before you report it to lenders or investors.
Frequently asked questions
What is a good DSO?
None of the sources cited here gives a universal number. OpenStax's finance textbook compares the collection period with the credit terms granted to customers, so the reference point is your own terms. On net 30 terms, a DSO in the low 30s suggests customers are paying about on time. The same figure on net 15 terms suggests they are paying about two weeks late.
What is the average DSO by industry?
No official industry-by-industry average was found for this article. US Census Bureau totals for 2025 work out to about 47 days for manufacturing, 37 for wholesale, 52 for information and 14 for retail when receivables are measured against all net sales. Those are this site's calculations on aggregate data for large corporations.
Why is my DSO higher than my payment terms?
Because some invoices are paid late, or because the formula counts amounts that aren't due yet in an unusual way, such as annual invoices billed in advance. Best possible DSO separates the two: it shows what DSO would be with nothing overdue.
Is DSO under 45 days good?
It depends on the terms. In the example above, Company A's 42 days included 10 days of lateness on net 30 terms, while the same 42 days on net 60 terms would be ahead of terms. A fixed threshold ignores that.
How often should DSO be measured?
At each month-end or quarter-end, with the same formula every time. A single reading can be skewed by one large invoice at period-end, so compare several periods.