The days sales in receivables formula tells you how many days of credit sales are sitting in accounts receivable, which is roughly how long customers take to pay. OpenStax's accounting textbook writes it as 365 divided by the accounts receivable turnover ratio.
The arithmetic takes a minute. The work is in choosing the inputs: which sales, which receivables balance and how many days. Each choice changes the answer, sometimes by more than ten days.
Quick answer: Days' sales in receivables = 365 ÷ accounts receivable turnover, where turnover = net credit sales ÷ average accounts receivable. The same thing in one step: average accounts receivable ÷ net credit sales × 365. With $730,000 of net credit sales and $100,000 of average receivables, the result is 50 days.
The days sales in receivables formula in two forms
Both forms give the same number. OpenStax's chapter on receivables ratios builds it in two steps:
- Accounts receivable turnover = net credit sales ÷ average accounts receivable
- Number of days' sales in receivables = 365 ÷ accounts receivable turnover
Turnover says how many times in the period receivables were collected and converted to cash. Dividing 365 by it converts "times per year" into days.
Substitute the first line into the second and you get the one-step form:
Days' sales in receivables = average accounts receivable ÷ net credit sales × 365
OpenStax's finance textbook uses the same calculation in its section on working capital under the name receivables collection period, and says it is also called days sales outstanding (DSO) or the average collection period. So the names overlap. The inputs behind them can differ, which is why two "DSO" figures can't be compared until you know how each was built.
Each input, explained
The days sales in receivables formula has three inputs, and each one comes with a decision.
| Input | Textbook choice | Common alternative | Effect of the alternative |
|---|---|---|---|
| Sales | Net credit sales | Total net sales | Lower result if some sales are paid at once |
| Receivables | Average of beginning and ending balances | Ending balance only | Higher result if receivables grew in the period |
| Days | 365 | 360 | Slightly lower result |
Net credit sales, not total sales
Only sales made on credit belong in the formula. OpenStax's reason is that cash sales are left out because they don't produce receivables. In a software business, a subscription charged to a card at checkout is the equivalent of a cash sale here: OpenStax's finance textbook says credit card sales are not technically accounts receivable. An invoice sent on net 30 terms is a credit sale.
"Net" means after reductions. In OpenStax's income statement example, net sales are sales less sales discounts and sales returns and allowances. A credit memo issued against an invoice is one such reduction.
An outside reader may not be able to see the split. OpenStax notes that many companies don't report credit sales separately, so net sales may be substituted. If you are computing the ratio for your own business, you have the split. Use it.
Average receivables, not just the ending balance
The textbook averages the beginning and ending balances: (beginning accounts receivable + ending accounts receivable) ÷ 2. The beginning balance is the prior period's ending balance.
The reason is a mismatch. Sales are a total for the whole period, while a balance sheet figure is one day's snapshot. Averaging two snapshots gets closer to what was outstanding during the period.
Not everyone averages. HP Inc.'s annual report for fiscal 2025, for example, calculates its DSO from ending accounts receivable, net of the allowance for credit losses, divided by a 90-day average of net revenue. That measures the balance on the last day against the most recent quarter's pace of sales.
365 days or 360
OpenStax uses 365. Some companies use 360: Coherent, Inc.'s annual report for fiscal 2020, for example, says it calculates its DSO in receivables using a 360-day year. The 360-day version is always about 1.4% lower, because 360 ÷ 365 = 0.986. Either works if you never mix them.
A worked calculation from an income statement and a balance sheet
This company is made up. It sells software, partly by card at checkout and partly on invoice. Figures are for the year ended December 31, 2026.
| From the income statement | Amount |
|---|---|
| Sales paid by card at checkout | $250,000 |
| Sales on invoice (credit sales) | $750,000 |
| Less: returns and allowances on credit sales | ($20,000) |
| Net credit sales | $730,000 |
| Total net sales ($250,000 + $730,000) | $980,000 |
| From the balance sheet | Amount |
|---|---|
| Accounts receivable, December 31, 2025 | $80,000 |
| Accounts receivable, December 31, 2026 | $120,000 |
Step 1: average receivables. ($80,000 + $120,000) ÷ 2 = $100,000.
Step 2: turnover. $730,000 ÷ $100,000 = 7.3 times.
Step 3: days. 365 ÷ 7.3 = 50 days.
Check it with the one-step form: $100,000 ÷ $730,000 × 365 = 50 days. The company's credit sales run at $2,000 a day ($730,000 ÷ 365), and $100,000 of receivables is 50 days of that.
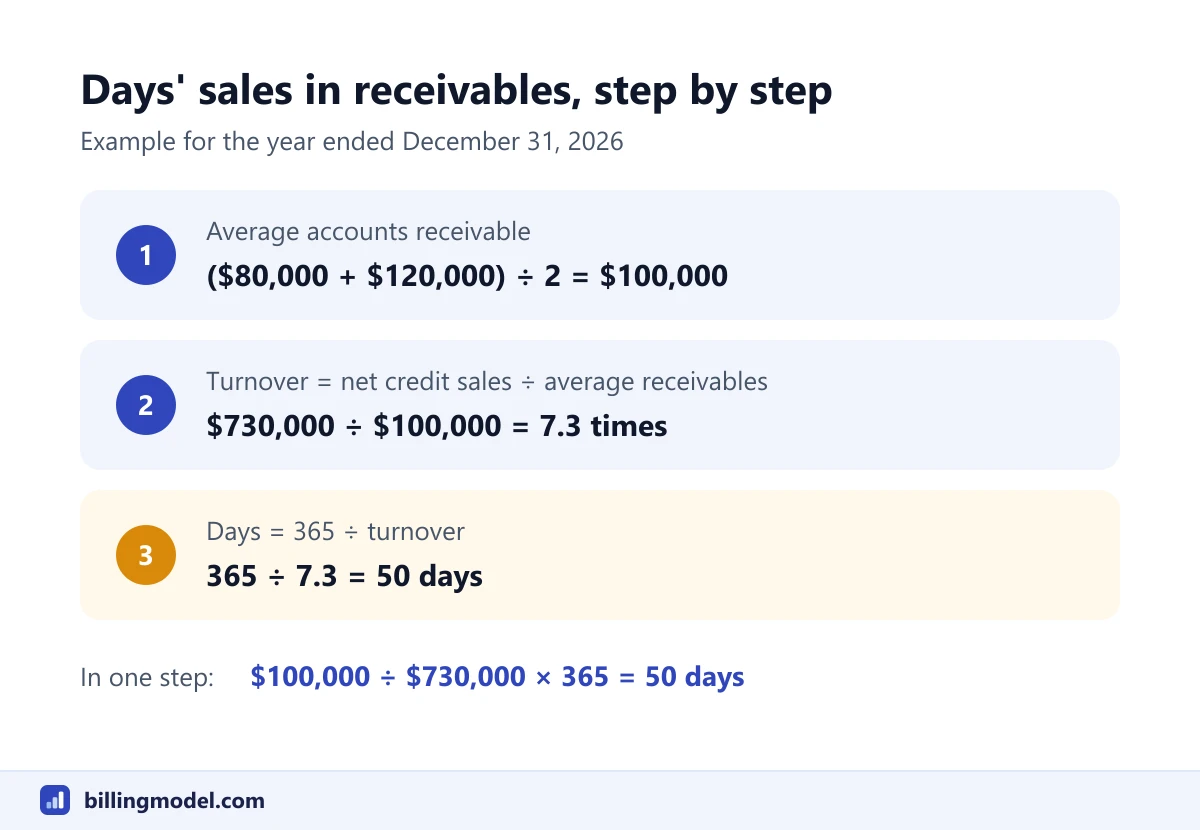 The example in three steps: average the receivables, compute turnover, divide 365 by it.
What the other input choices do to the answer
Change one input at a time and the same company reports four different numbers.
| Version | Calculation | Result |
|---|---|---|
| Textbook inputs | $100,000 ÷ $730,000 × 365 | 50.0 days |
| Total net sales instead of credit sales | $100,000 ÷ $980,000 × 365 | 37.2 days |
| Ending receivables instead of average | $120,000 ÷ $730,000 × 365 | 60.0 days |
| 360 days instead of 365 | $100,000 ÷ $730,000 × 360 | 49.3 days |
The spread from 37 to 60 days comes from definitions alone. Nothing about the customers changed.
Quarterly and monthly versions
For a shorter period, replace 365 with the number of days in that period and use that period's sales and receivables. The general form is:
Days' sales in receivables = average receivables for the period ÷ net credit sales for the period × days in the period
Fourth quarter (October 1 to December 31, 2026, 92 days). Net credit sales were $230,000. Receivables were $110,000 on September 30 and $120,000 on December 31, an average of $115,000.
$115,000 ÷ $230,000 × 92 = 46 days.
December 2026 (31 days). Net credit sales were $85,000. Receivables were $116,000 on November 30 and $120,000 on December 31, an average of $118,000.
$118,000 ÷ $85,000 × 31 = 43 days, rounded from 43.04.
The year gives 50 days, the quarter 46 and the month 43. They differ because this company's sales were higher late in the year: $2,000 a day across the year, $2,500 a day in the fourth quarter ($230,000 ÷ 92). A short period reacts faster to recent sales, and it also swings more from one period to the next.
Watch out: Quarterly sales with a 365-day multiplier is an easy slip. $115,000 ÷ $230,000 × 365 gives 182.5 days, almost four times the real figure.
Common mistakes with the days sales in receivables formula
- Mismatched periods. Sales, receivables and the day count must all describe the same period.
- Total sales when you know credit sales. In the example it turns 50 days into 37 and makes collection look faster than it is.
- Switching between average and ending balances. Either is defensible. Changing from one month to the next creates movements that aren't real.
- Mixing 360 and 365. Small, but it matters when you are tracking a change of a day or two.
- Comparing against a figure built differently. HP divides an ending balance by a 90-day revenue average. Another filer cited in the accounts receivable aging report article adjusted receivables for unbilled amounts and deferred revenue. Read the definition before you compare.
- Reading the result as every customer's payment time. It is one average. An aging report shows which invoices are behind it.
How to read the result
Compare the number with your own credit terms first. OpenStax's finance textbook says, in its section on receivables management, that setting the collection period against the terms granted to customers can reveal collection problems. Fifty days against net 30 payment terms raises a question. Fifty days against net 45 raises a smaller one.
Then compare it with your own earlier periods, computed the same way. OpenStax's accounting chapter says that fewer collection days are generally better, since cash arrives sooner. It also warns that a very high turnover can mean credit terms are too tight, which may push qualified customers to competitors.
What counts as normal depends on the industry and the terms offered. The article on average DSO covers how to benchmark, and DSO vs DPO sets the receivables side against what you owe suppliers.
This is an analysis ratio, and the sources above don't all define it the same way. Which sales and receivables belong in it depends on your company's facts, such as how you treat unbilled amounts, so have a qualified accountant confirm the definition you report.
Frequently asked questions
Is days' sales in receivables the same as DSO?
OpenStax's finance textbook treats them as names for the same measure. Companies that publish a DSO figure define it in their own ways, for example with ending receivables and a 90-day revenue average. Treat the names as equivalent and the numbers as comparable only when the inputs match.
Is ending or average accounts receivable the right input?
The textbook formula uses the average of the beginning and ending balances. Ending receivables give a more current reading, and HP's filing is one example of a company that reports its figure that way. Pick one and keep it.
Why does the formula use 365?
It converts a yearly turnover figure into days. For a quarter or a month, use the days in that period instead: 90, 91 or 92 for a quarter, 28 to 31 for a month.
What if credit sales aren't tracked separately?
Use total net sales, which OpenStax accepts as a substitute when credit sales aren't reported separately. The result will be lower than the true figure by an amount that depends on how much of your revenue is paid at the time of sale.
What is a good number of days' sales in receivables?
No single number fits every business. A result close to your stated payment terms means customers are paying roughly on time. A result well above them means some are not.